

Analytics
Analytics shows how a project’s assistant is doing — volume, responsiveness, and satisfaction.
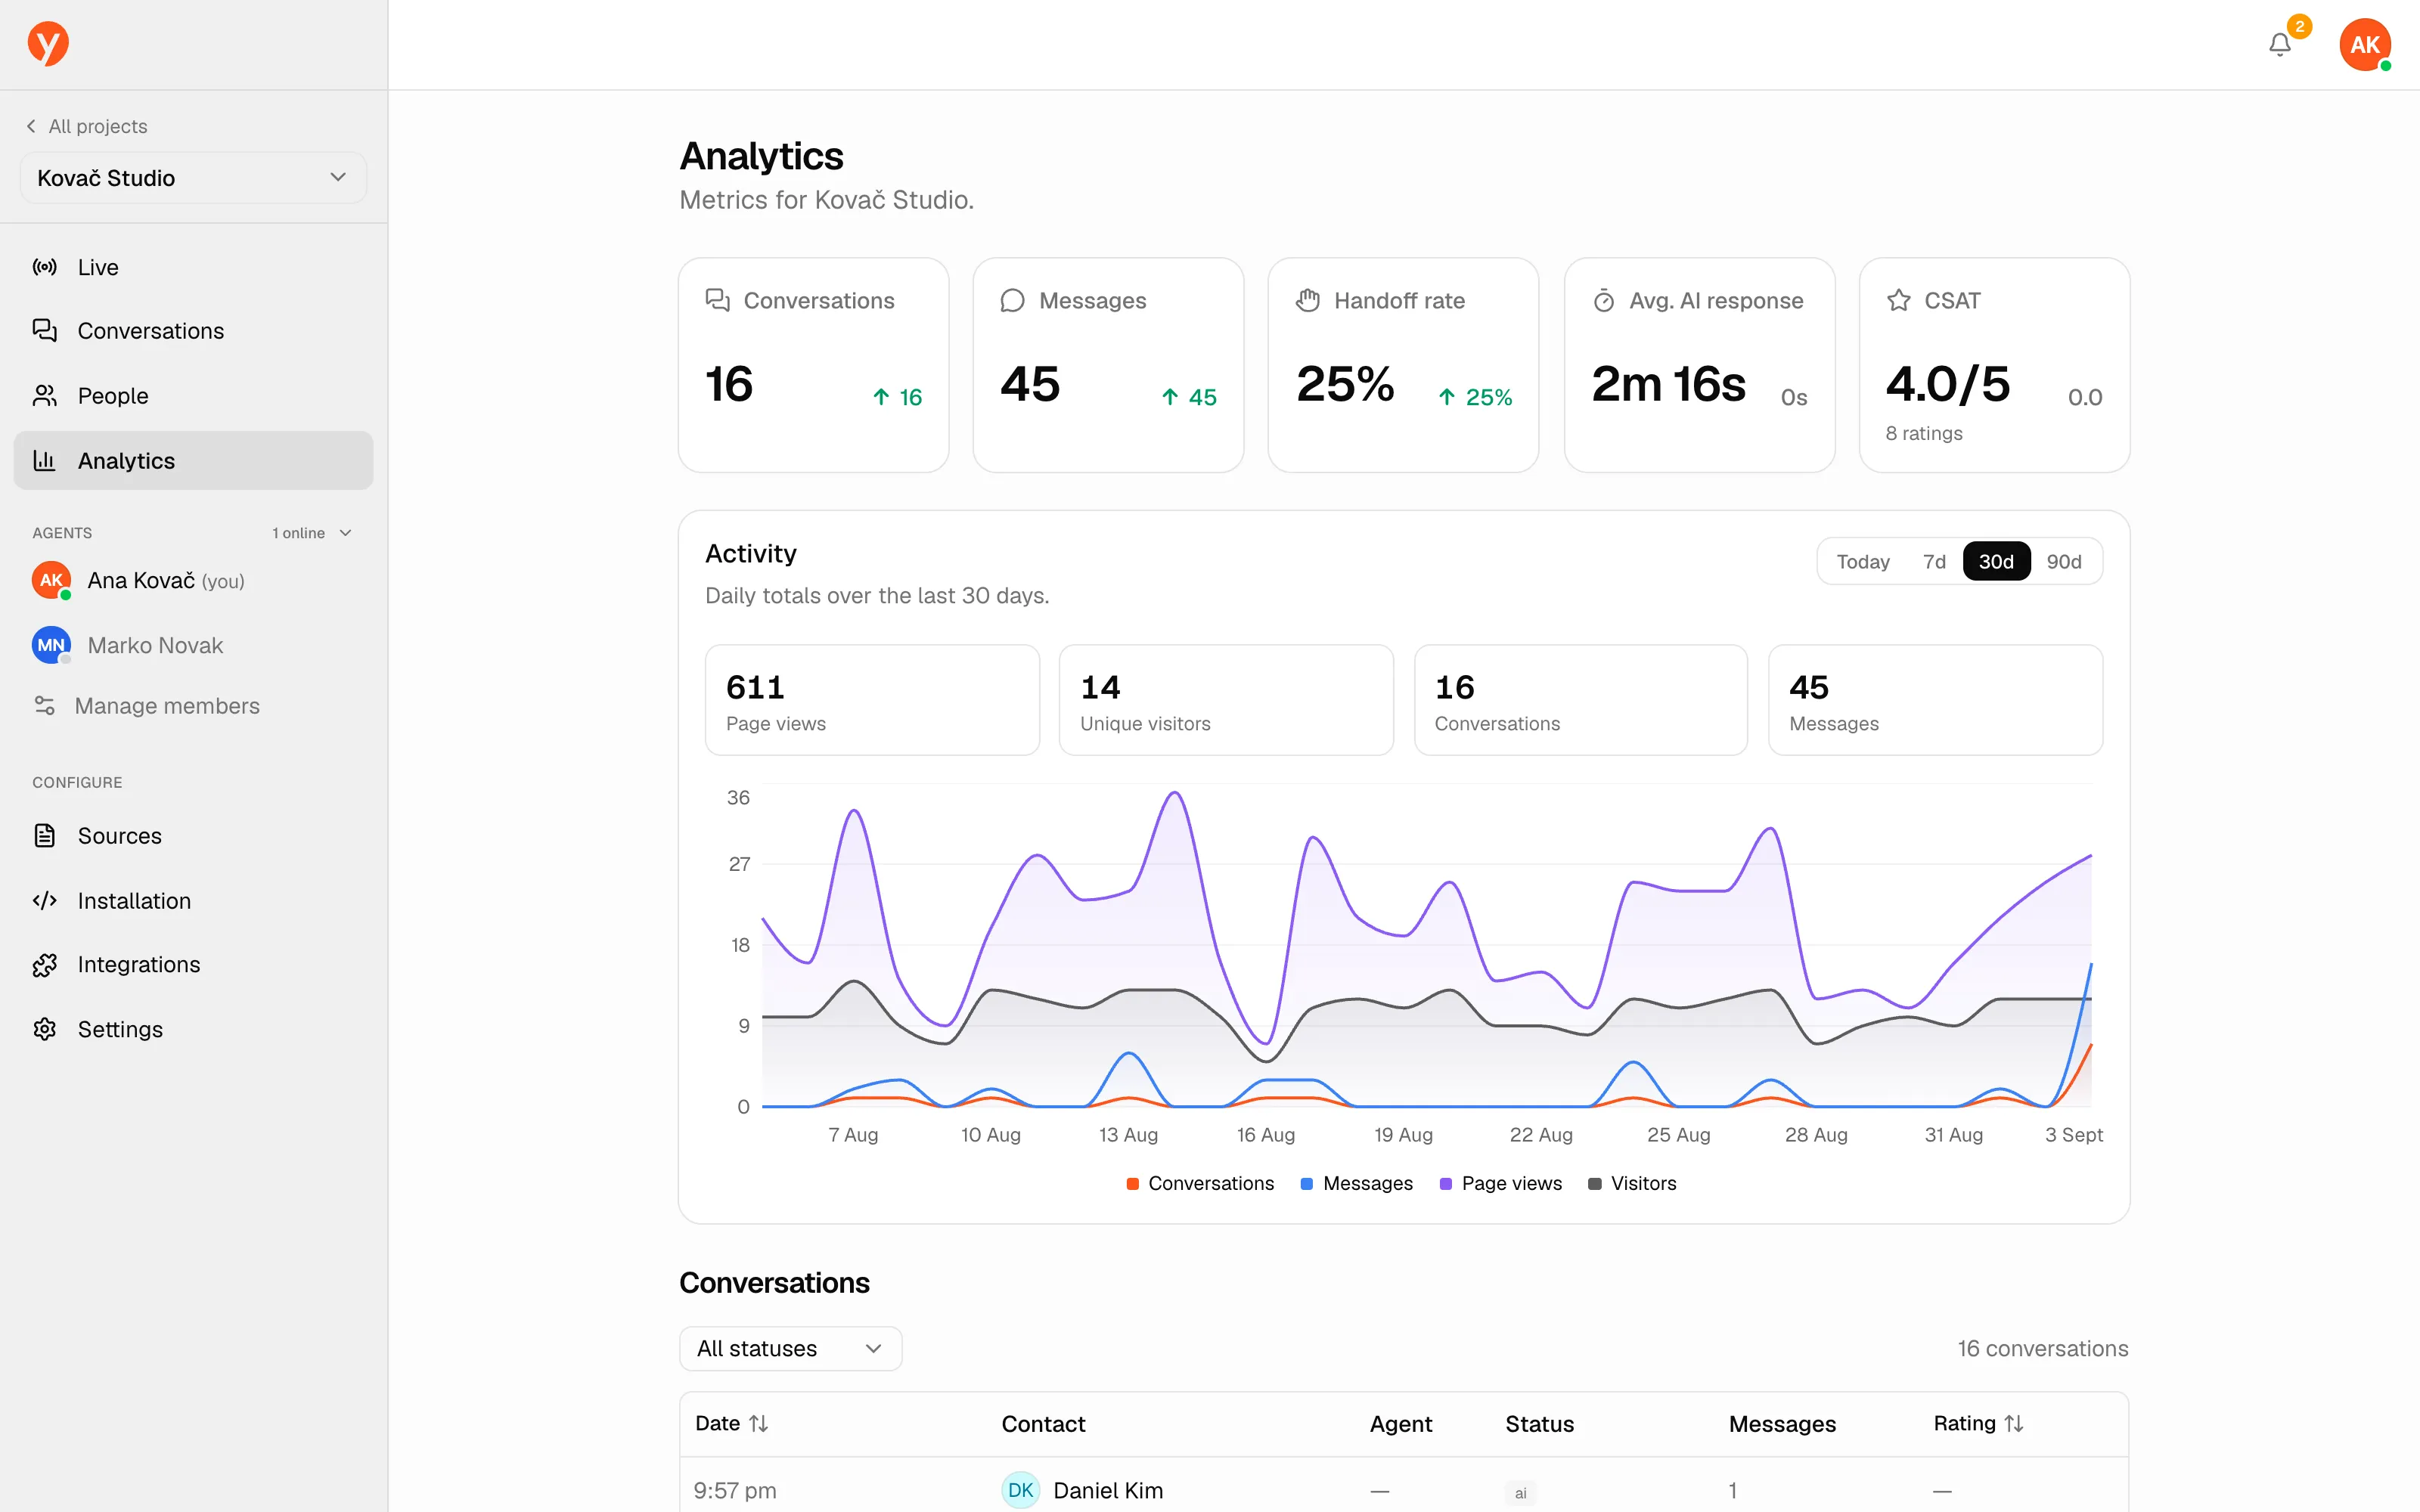
Metrics
Section titled “Metrics”| Metric | What it means |
|---|---|
| Conversations | Total conversations. |
| Messages | Total messages exchanged. |
| Handoff rate | Share of conversations handed to a human — whether the visitor asked or the AI escalated on its own — ÷ total conversations. |
| Avg. AI response | Mean time for the AI to reply after a visitor message. |
| CSAT | Average of the 1–5 ratings visitors leave when a chat ends, split into AI (chats the AI handled alone) and Team (chats a teammate replied in). |
| Helpful answers | Share of rated AI answers that got a thumbs-up, with the number of rated answers. |
The metric cards show all-time values with a trend badge comparing the selected window to the one before it.
Activity chart
Section titled “Activity chart”The activity chart tracks page views, visitors, conversations, and messages over time. Pick the range — Today, 7, 30 (default), or 90 days — and it applies across Overview, Live, and Analytics. A table below lists recent conversations with their status.
Where chats start
Section titled “Where chats start”Conversations from the last 30 days by where the chat is installed: Floating
chat, On the page or iframe, with each one’s share and average rating.
Installs you’ve labelled with data-placement (or ?placement= on the iframe
URL) are listed under their type, so you can compare, say, the chat on your
contact page with the floating bubble. See
Telling installs apart.
Each conversation also shows its placement and starting page in the visitor panel, under Session → Chat started from. For iframe chats the browser usually reveals only your site’s address, not the exact page.
Thumbs-down reasons
Section titled “Thumbs-down reasons”When satisfaction ratings are on and a visitor gives an AI answer a thumbs-down, they can tap a reason: Wrong, Didn’t answer my question (incomplete), or Outdated. These reasons feed the Content gaps page.